Processing Architecture
Understanding how Kelora processes logs through its multi-layer architecture.
Overview
Kelora's processing model consists of three distinct layers operating on different data types:
- Input Layer - File/stdin handling and decompression
- Line-Level Processing - Raw string filtering and event boundary detection
- Event-Level Processing - Structured data transformation and output
This layered architecture enables efficient streaming with low memory usage while supporting both sequential and parallel processing modes.
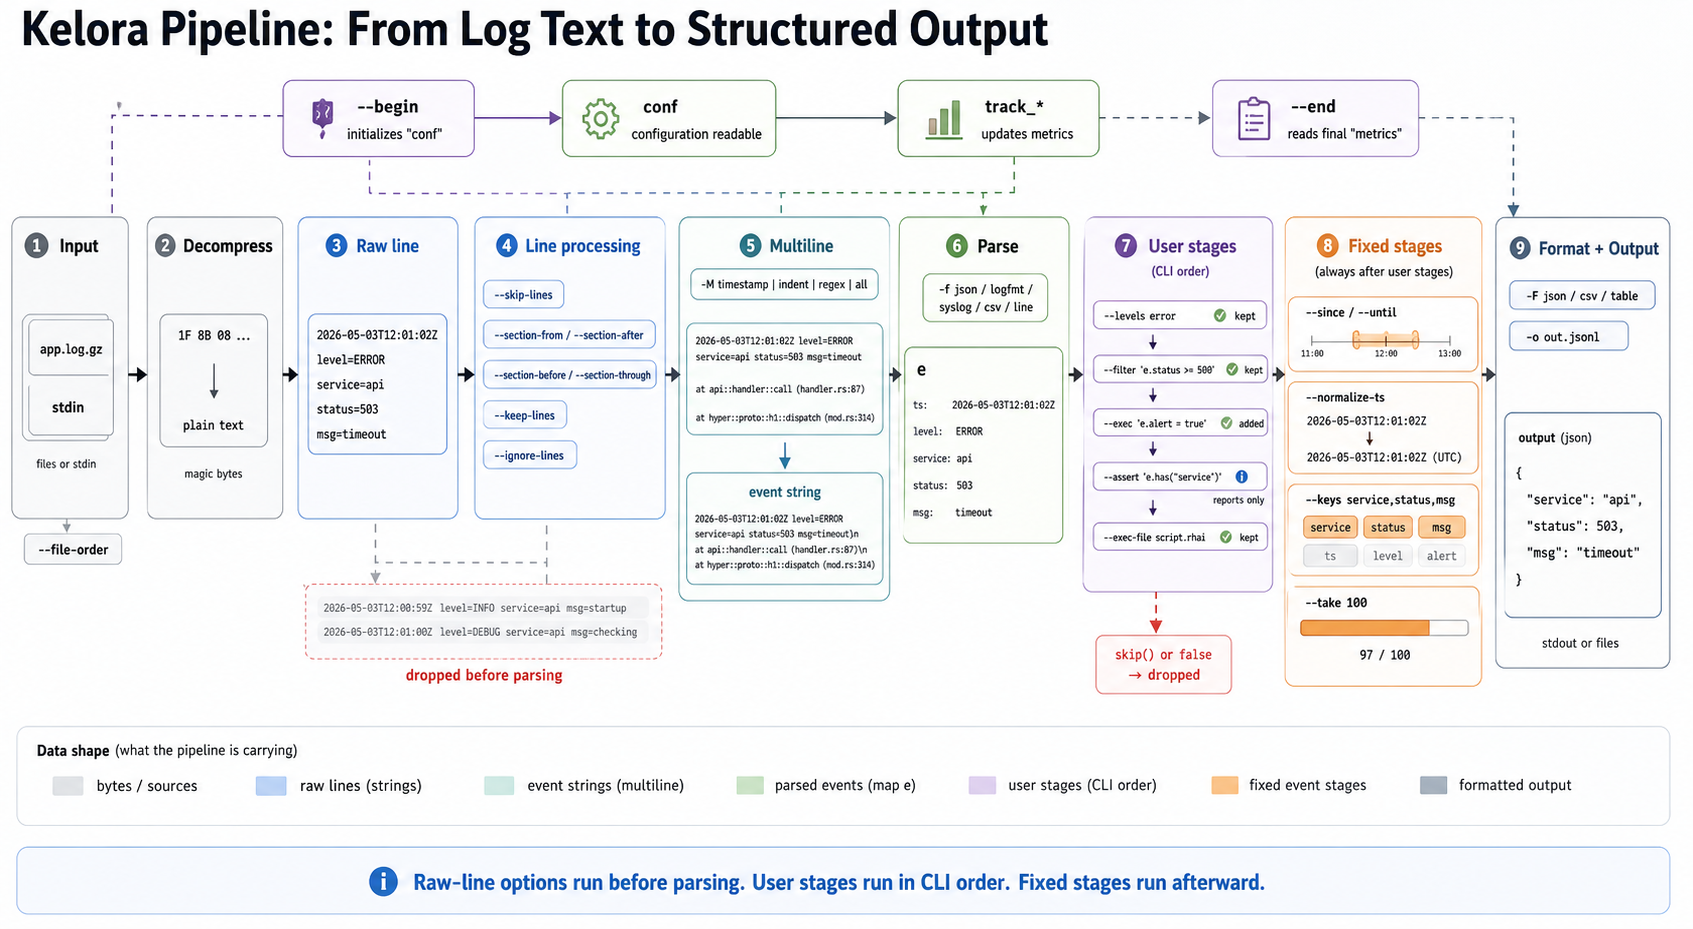
Click the diagram to open it full-size.
Diagram summary: Kelora runs raw-line options before parsing, then parses complete event strings into event maps. User stages (--filter, --levels, --exec, --assert, and related flags) run in CLI order. Fixed event stages such as timestamp filtering, key selection, and --take run afterward.
Pipeline diagram description: a sample compressed input file becomes raw log lines, then line processing drops unwanted lines before parsing. Multiline aggregation can combine stack traces into one event string. The parser creates event map e, user stages run in CLI order, fixed event stages run afterward, and the formatter emits structured output. A lifecycle rail shows --begin, conf, track_* metrics updates, and --end.
Quick Start: What You'll Use Most
For typical log analysis, you only interact with these stages:
- Input - Kelora auto-detects format (JSON, logfmt, syslog, etc.) from your files
- Event Processing - Use
--filterand--execin the order you specify them on the CLI - Output - Events stream to stdout in readable format
Read the full doc when: You need multiline handling for stack traces, parallel processing for large files, span aggregation for grouping events, or to understand why certain features interact the way they do.
Layer 1: Input Layer
Input Sources
Stdin Mode:
- Activated when no files specified or file is
"-" - Background thread reads from stdin via channel
- Supports one stdin source (error if
"-"appears multiple times) - Useful for piping:
tail -f app.log | kelora -j
File Mode:
- Processes one or more files sequentially
- Tracks current filename for context
- Supports
--file-orderfor processing sequence: cli(default) - Process in CLI argument ordername- Sort alphabeticallymtime- Sort by modification time (oldest first)
Examples:
# Stdin mode
tail -f app.log | kelora -j

# File mode with ordering
kelora *.log --file-order mtime

# Mixed stdin and files
kelora file1.log - file2.log  # stdin in middle
Automatic Decompression
Kelora automatically detects and decompresses compressed input using magic bytes detection (not file extensions):
Supported Formats:
- Gzip - Magic bytes
1F 8B 08(.gzfiles or gzipped stdin) - Zstd - Magic bytes
28 B5 2F FD(.zstfiles or zstd stdin) - Plain - No magic bytes, passthrough
Behavior:
- Transparent decompression before any processing
- Works on both files and stdin
- ZIP files explicitly rejected with error message
- Decompression happens in Input Layer
Examples:
kelora app.log.gz                    # Auto-detected gzip
kelora app.log.zst --parallel        # Auto-detected zstd
gzip -c app.log | kelora -j          # Gzipped stdin
Reader Threading
Sequential Mode:
- Spawns background reader thread
- Sends lines via bounded channel (1024 line buffer)
- Main thread processes lines one at a time
- Supports multiline timeout flush (default: 200ms)
Parallel Mode:
- Reader batches lines (default: 1000 lines, 200ms timeout)
- Worker pool processes batches concurrently
- No cross-batch state (impacts multiline, spans)
Layer 2: Line-Level Processing
Operations on raw string lines before parsing into events.
Line Skipping (--skip-lines)
Skip first N lines from input (useful for CSV headers, preambles).
Line Filtering (--ignore-lines, --keep-lines)
Regex-based filtering on raw lines before parsing:
--ignore-lines <REGEX>- Skip lines matching pattern--keep-lines <REGEX>- Keep only lines matching pattern
Resilient mode: Skip non-matching lines, continue processing Strict mode: Abort on regex error
# Ignore health checks before parsing
kelora access.log --ignore-lines 'health-check'

# Keep only lines starting with timestamp
kelora app.log --keep-lines '^\d{4}-\d{2}-\d{2}'
Section Selection
Extract specific sections from logs based on start/end markers:
Flags:
--section-after <REGEX>- Begin section (exclude marker line)--section-from <REGEX>- Begin section (include marker line)--section-through <REGEX>- End section (include marker line)--section-before <REGEX>- End section (exclude marker line)--max-sections <N>- Limit number of sections
State Machine:
Example:
# Extract sections between markers
kelora system.log \
    --section-from '=== Test Started ===' \
    --section-through '=== Test Completed ==='
Event Aggregation (Multiline)
Detects event boundaries to combine multiple lines into single events before parsing.
Four Strategies:
1. Timestamp Strategy (auto-detect timestamp headers)
Detects lines starting with timestamps as new events. Continuation lines (stack traces, wrapped messages) are appended to current event.2. Indent Strategy (whitespace continuation)
Lines starting with whitespace are continuations of previous event.3. Regex Strategy (custom patterns)
Define custom start/end patterns for event boundaries usingmatch= (required) and end= (optional) segments within the -M argument.
4. All Strategy (entire input as one event)
Buffers entire input as single event (use for structured files).Note: The current CLI treats : as an option separator inside the -M value. For regex patterns, encode literal colons (for example \x3A). Timestamp hints that require : currently need pre-normalised input or a regex-based strategy.
Multiline Timeout:
- Sequential mode: Flush incomplete events after timeout (default: 200ms)
- Parallel mode: Flush at batch boundaries (no timeout)
Critical: Multiline creates event boundaries before parsing. Each complete event string is then parsed into structured data.
Layer 3: Event-Level Processing
Operations on parsed events (maps/objects).
Parsing
Convert complete event strings into structured maps:
Parsers: json, logfmt, syslog, combined, csv, tsv, cols, etc.
Script Stages (Pipeline Core)
User-controlled stages execute exactly where you place them on the CLI:
--filter <EXPR>– Boolean filter (true = keep, false = skip)--levels/-l <LIST>– Include log levels (comma-separated for OR; use separate flags for progressive filtering)--exclude-levels/-L <LIST>– Exclude log levels (comma-separated)--exec <SCRIPT>– Transform/process event--exec-file <PATH>– Execute script from file (alias:-E)
You can mix and repeat these flags; each stage sees the output of the previous one. For level filtering, use comma-separated values for OR logic (--levels error,warn). Consecutive --levels flags create AND filters (advanced).
Inside --exec, call skip() to drop the current event immediately; later stages and output are skipped, and the event is counted as filtered.
Example:
kelora -j app.log \
    --levels error,critical \        # Stage 1: Level filter
    --filter 'e.status >= 400' \     # Stage 2: Filter
    --exec 'e.alert = true' \        # Stage 3: Exec (only 4xx/5xx errors)
    --exclude-levels debug \         # Stage 4: Remove any downgraded events
    --exec 'track_freq("path", e.path)'     # Stage 5: Exec (track surviving paths)
Each stage processes the output of the previous stage sequentially.
Complete Stage Ordering
User-controlled stages (run in the order you specify them on the CLI):
--filter,--levels,--exclude-levels,--exec,--exec-file,--assert
Fixed-position event stages (always run after user-controlled stages, regardless of CLI order):
- Timestamp filtering –
--since,--until - Timestamp conversion –
--normalize-ts - Drain summary –
--drain(sequential only) - Key filtering –
--keys,--exclude-keys - Take limit –
--take
Place --levels before heavy transforms to prune work early, or add another --levels after a script if you synthesise a level field there.
Span Processing
Groups events into spans for aggregation:
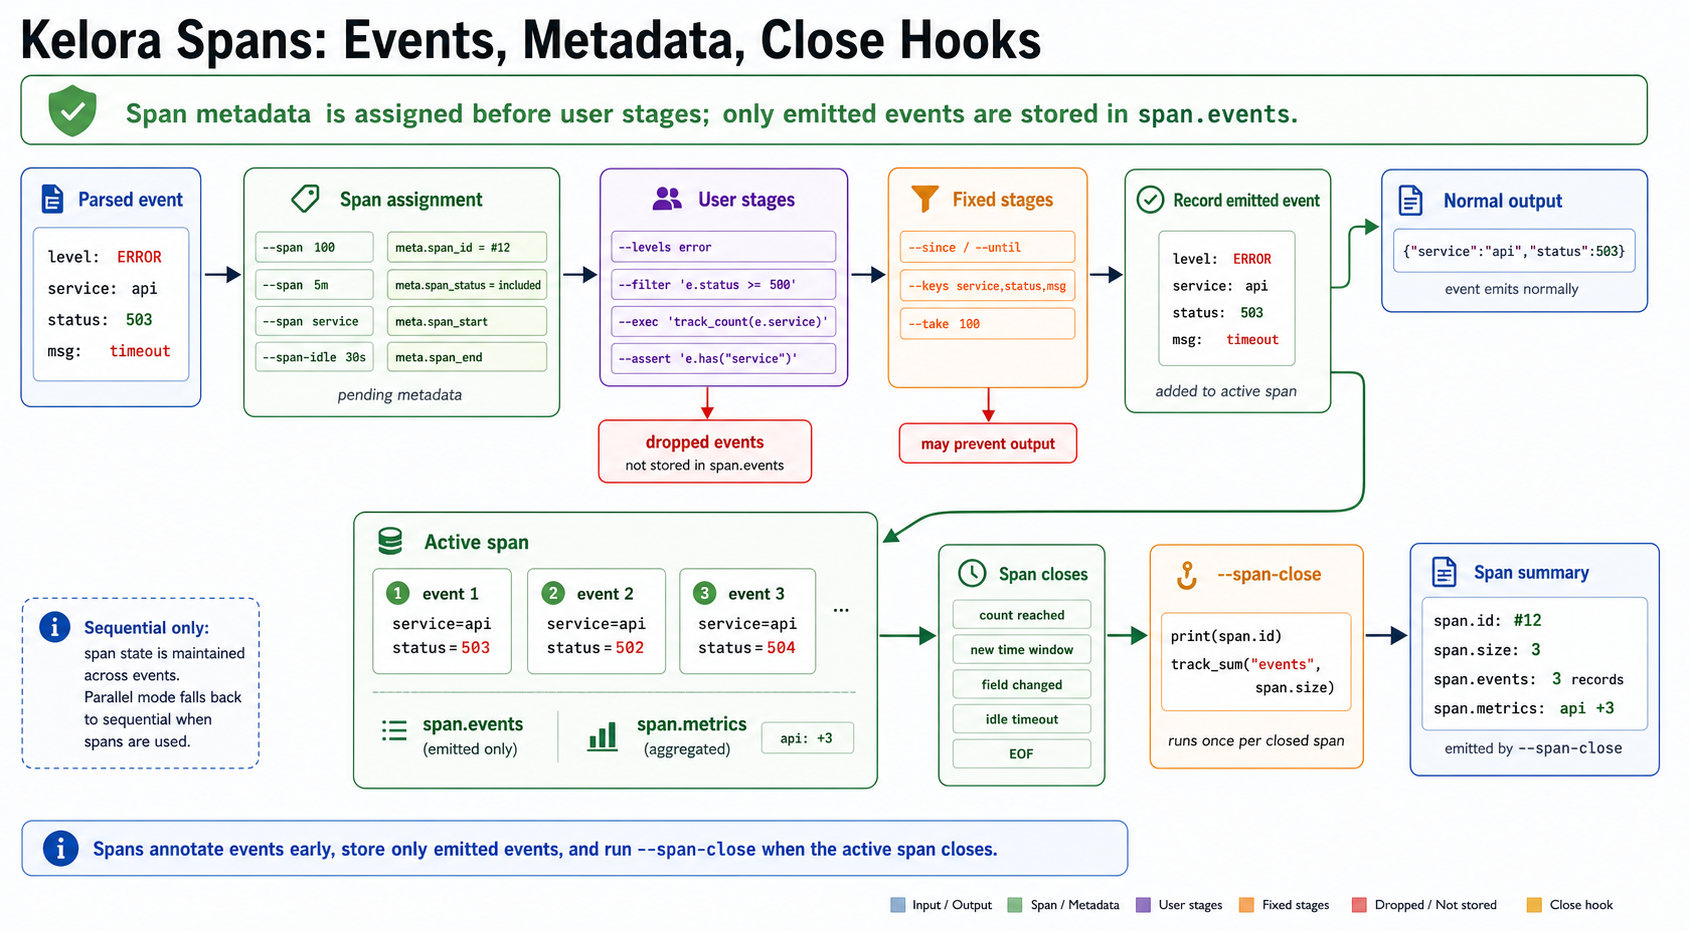
Click the diagram to open it full-size.
Diagram summary: Kelora assigns span metadata before user stages run, but only emitted events are stored in span.events. Dropped events are marked as filtered and excluded from the span buffer. When a span closes, --span-close runs once with the span binding and per-span metric deltas.
Count-based Spans:
Closes span every N events that pass filters.Time-based Spans:
Closes span on aligned time windows (5m, 1h, 30s, etc.).Span Processing Flow:
- Parser creates an event map
- Span processor assigns pending span metadata (
meta.span_id,meta.span_status,meta.span_start,meta.span_end) - User stages and fixed event stages run
- Only emitted events are recorded in
span.events; dropped events are marked filtered and excluded - When span closes →
--span-closehook executes withspanandmetrics
Constraints:
- Spans force sequential mode (incompatible with
--parallel) - Span state maintained across events
Begin and End Stages
--begin: Execute once before processing any events
--end: Execute once after all events processed
kelora -j app.log \
    --begin 'print("Starting analysis")' \
    --exec 'track_freq("service", e.service)' \
    --end 'print("Services seen: " + metrics.len())' \
    --metrics
In parallel mode:
--beginruns sequentially before worker pool starts--endruns sequentially after workers complete (with merged metrics)
Context Lines
Show surrounding lines around matches:
--before-context N/-B N- Show N lines before match--after-context N/-A N- Show N lines after match--context N/-C N- Show N lines before and after
Requires active filtering (--filter, --levels, --since, etc.).
Output Stage
Format and emit events:
- Apply
--keysfield selection - Convert timestamps (--normalize-ts, --show-ts-local, --show-ts-utc)
- Format output (--output-format: default, json, csv, etc.)
- Apply
--takelimit - Write to stdout or files
Parallel Processing Model
Kelora's --parallel mode is batch-parallel, not stage-parallel.
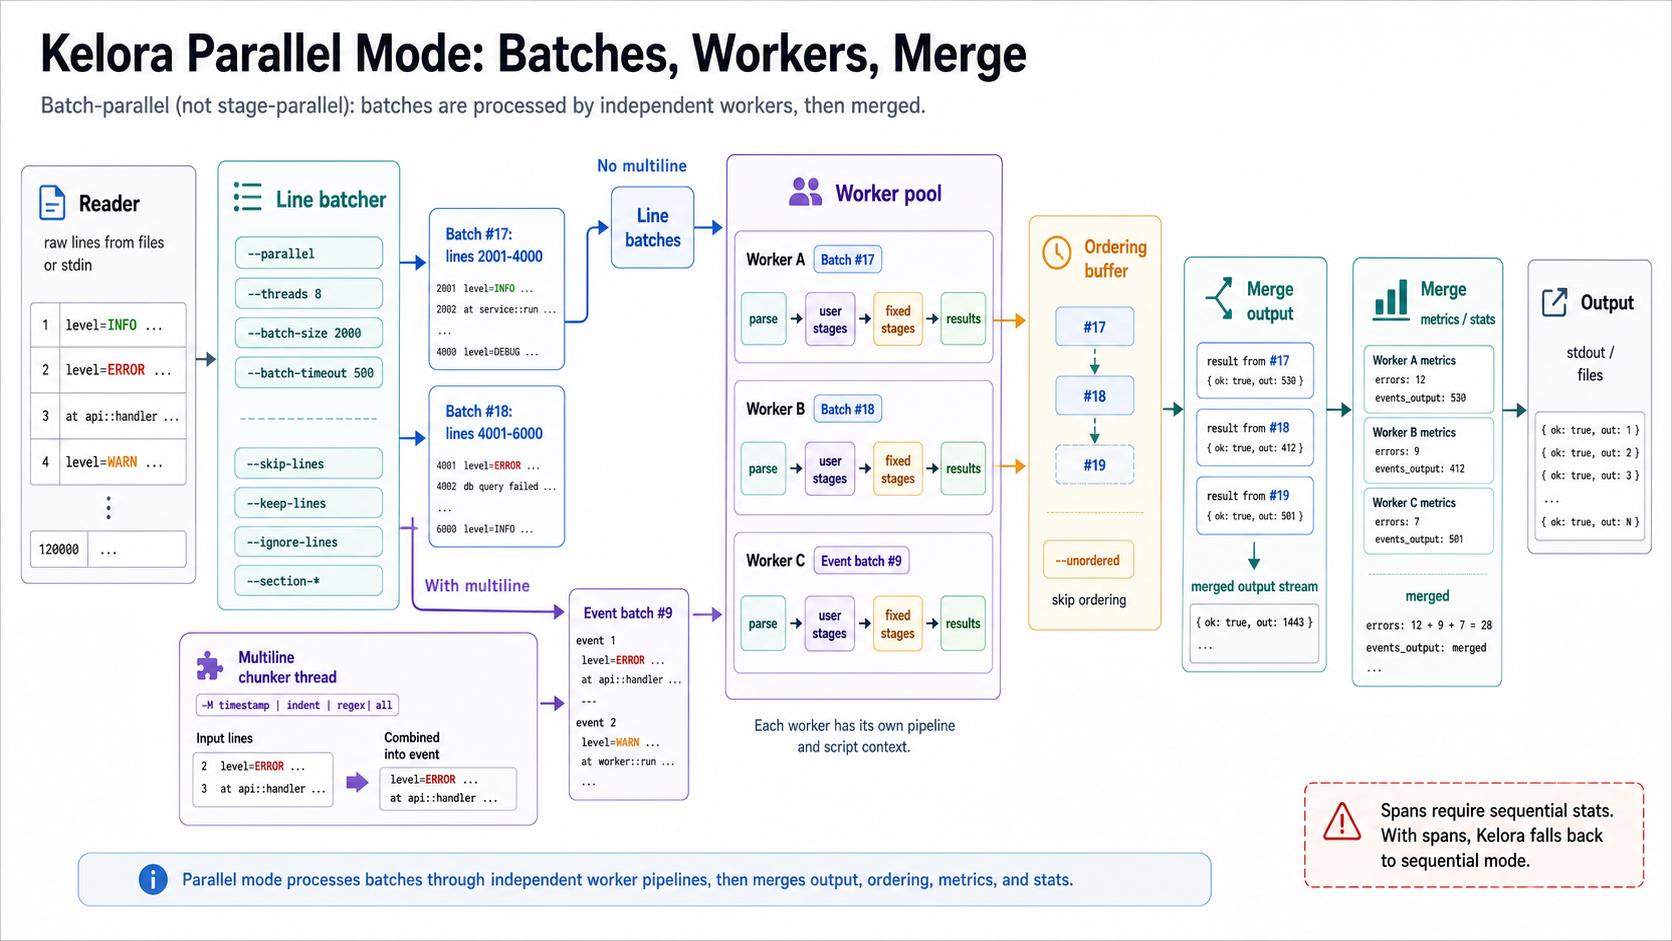
Click the diagram to open it full-size.
Diagram summary: Parallel mode batches raw lines. Without multiline, workers receive line batches directly. With multiline enabled, a chunker thread builds complete event strings before worker processing. Workers run independent pipeline instances, then Kelora merges results, ordering, metrics, and stats.
Architecture
Sequential:  Line → Line filters → Multiline → Parse → Script stages → Output
             (one at a time)

Parallel:    Lines → Line filters → Line batches
             Without multiline: batches → Worker pool
             With multiline: batches → Chunker thread → Event batches → Worker pool
             Each worker: Parse → Script stages → Fixed stages
             Results → Ordering buffer → Output
Where:
- Line filters =
--skip-lines, section selection,--keep-lines,--ignore-lines - Multiline = Event boundary detection (aggregates multiple lines into events)
- Script stages =
--filter,--levels,--exclude-levels,--exec,--assert, and--exec-filein CLI order
How It Works
- Reader thread reads lines from input
- Batcher thread applies early line processing and batches surviving lines (default: 1000 lines, 200ms timeout)
- With multiline enabled, a chunker thread converts line batches into complete event strings before worker processing
- Worker pool processes batches independently (default: CPU count workers)
- Each worker has its own Pipeline instance
- Results merged with ordering preservation (default) or unordered (
--unordered) - Stats/metrics merged from all workers
Configuration:
Constraints and Tradeoffs
Incompatible Features:
- Spans - Cannot maintain span state across batches (forces sequential)
- Cross-event context (
--window,-B/-C) - Order-dependent across batches, so it also forces sequential. kelora ignores--parallel/--threads/--batch-size(with a warning) when these are set; otherwise per-worker buffers would silently return wrong cross-event results.
Multiline Behavior:
- With multiline enabled, a dedicated chunker thread creates complete event strings before workers run
- This avoids splitting multiline events at line-batch boundaries
- Multiline workloads may still parallelize less efficiently because chunking is a shared upstream step
Ordering:
- Default: Preserve input order (adds overhead)
--unordered: Trade ordering for maximum throughput
Best For:
- Large files with independent events
- CPU-bound transformations (regex, hashing, calculations)
- High-throughput batch processing
Not Ideal For:
- Real-time streaming (use sequential)
- Cross-event analysis (use spans in sequential mode)
- Small files (overhead exceeds benefit)
Metrics and Statistics
Kelora maintains two tracking systems:
User Metrics (--metrics)
Populated by Rhai functions in --exec scripts:
kelora -j app.log \
    --exec 'track_freq("service", e.service)' \
    --exec 'track_sum("total_bytes", e.bytes)' \
    --exec 'track_unique("users", e.user_id)' \
    --metrics
Available Functions:
track_freq(name, value)- Count occurrences per categorytrack_sum(key, value)- Sum valuestrack_min(key, value)- Track minimum valuetrack_max(key, value)- Track maximum valuetrack_unique(key, value)- Collect unique values (exact, stores all)track_cardinality(key, value)- Estimate unique count (HyperLogLog, ~1% error)track_top(name, item [, n])- Track most frequent items
Access in --end stage:
kelora -j app.log \
    --exec 'track_freq("service", e.service)' \
    --end 'print("Total services: " + metrics.len())' \
    --metrics
Output:
- Printed to stderr with
--metrics - Written to JSON file with
--metrics-file metrics.json
Internal Statistics (--stats)
Auto-collected counters:
events_created- Parsed eventsevents_output- Output eventsevents_filtered- Filtered eventsdiscovered_levels- Log levels seendiscovered_keys- Field names seen- Parse errors, filter errors, etc.
Parallel Metrics Merging
In parallel mode:
- Each worker maintains local tracking state
- GlobalTracker merges worker states after processing:
- Counters: summed
- Unique sets: unioned
- Averages: recomputed from sums and counts
- Merged metrics available in
--endstage
Error Handling
Resilient Mode (Default)
- Parse errors: Skip line, continue processing
- Filter errors: Treat as
false, skip event - Transform errors: Return original event unchanged
- Summary: Show recovered runtime errors as warnings at end
- Exit code: Recovered filter/exec errors exit
0; use--strictto fail on them
Strict Mode (--strict)
- Any error: Abort immediately with exit code 1
- No summary: Program exits on first error
Verbosity Levels
-v/--verbose- Show detailed errors (level 1)-vv- More verbose (level 2)-vvv- Maximum verbosity (level 3)
Quiet/Output Modes
-q/--quiet- Suppress events--no-diagnostics- Suppress diagnostics (fatal line still emitted)--silent- Suppress pipeline terminal output (events, diagnostics, stats, terminal metrics); script output still allowed unless you add--no-script-outputor use data-only modes; one fatal line on errors; metrics files still write
Complete Data Flow
┌─────────────────────────────────────────┐
│  Layer 1: Input                         │
├─────────────────────────────────────────┤
│  • Stdin or Files (--file-order)        │
│  • Automatic decompression (gzip/zstd)  │
│  • Reader thread spawning               │
└──────────────┬──────────────────────────┘
               │ Raw lines
┌──────────────▼──────────────────────────┐
│  Layer 2: Line-Level Processing         │
├─────────────────────────────────────────┤
│  • --skip-lines (skip first N)          │
│  • --section-from/through (sections)    │
│  • --ignore-lines/--keep-lines (regex)  │
│  • Multiline chunker (event boundaries) │
└──────────────┬──────────────────────────┘
               │ Complete event strings
┌──────────────▼──────────────────────────┐
│  Layer 3: Event-Level Processing        │
├─────────────────────────────────────────┤
│  • Parser → Event map                   │
│  • Span preparation (assign span_id)    │
│  • User stages in CLI order             │
│    - --filter/--levels/--exec/--assert  │
│  • Fixed event stages                   │
│    - --since/--until, --keys, etc.      │
│  • Take limiter (--take)                │
│  • Span close hooks (--span-close)      │
│  • Output formatting                    │
└──────────────┬──────────────────────────┘
               │ Formatted output
               ▼
           stdout/files
Parallel Mode Differences:
Reader → line filtering/batching → optional multiline chunker → Worker pool
Each worker independently:

  - Parse event strings
  - Event-level processing
Results → Ordering buffer → Merged output
Metrics → GlobalTracker → Merged stats
Performance Characteristics
Streaming
- Low memory usage - Events processed and discarded
- Real-time capable - Works with
tail -fand live streams - No lookahead - Cannot access future events (except with
--window)
Sequential vs Parallel
Sequential (default):
- Events processed in order
- Lower memory usage
- Predictable output order
- Supports spans and cross-event state
- Best for streaming and interactive use
Parallel (--parallel):
- Events processed in batches across cores
- Higher throughput for CPU-bound work
- Higher memory usage (batching + worker pools)
- Limited cross-event features
- Best for batch processing large files
Optimization Tips
Early filtering:
# Good: Cheap filters first
kelora -j app.log \
    --levels error \
    --filter 'e.message.matches(r"expensive.*regex")'

# Less efficient: Expensive filter on all events
kelora -j app.log \
    --filter 'e.message.matches(r"expensive.*regex")' \
    --levels error
Use --keys to reduce output processing:
Parallel for CPU-bound transformations:
Use --take for quick exploration:
See Also
- Events and Fields - How events are structured
- Scripting Stages - Writing --filter and --exec scripts
- Error Handling - Resilient vs strict modes